


Google search statistics provide invaluable insights into how users interact with the world’s leading search engine. As a key resource for digital marketers, understanding these metrics can help optimize strategies, improve visibility, and drive more traffic to your website. In this comprehensive guide, we’ll explore a wide range of data points that highlight Google’s dominance, user behaviors, and emerging trends. Whether you’re refining your SEO approach or planning content, these statistics offer a roadmap to better performance.
Understanding the Scale of Google Searches
Google handles an enormous volume of queries every single minute, underscoring its role as the primary gateway to information online. Estimates show that the search engine processes around 9.5 million searches per minute. This staggering figure breaks down to trillions of queries annually, reflecting the platform’s integral place in daily life.
To put this into perspective, if we consider the global population, this equates to each person conducting hundreds of searches per year on average. For marketers, this highlights the immense opportunity: with so many searches happening constantly, appearing in relevant results can expose your brand to a massive audience. However, it also emphasizes the competition. To stand out, focus on creating high-quality, relevant content that aligns with user intent. Tools like keyword research platforms can help identify high-volume terms to target, ensuring your pages rank higher and capture a share of this traffic.
Beyond the raw numbers, the implications for SEO are profound. High search volumes mean that even small improvements in rankings can lead to significant traffic gains. For instance, optimizing for long-tail keywords phrases that are more specific and less competitive can help smaller sites compete against larger ones. This statistic also reminds us of the need for speed and efficiency in website design, as users expect quick answers. Slow-loading pages can lead to higher bounce rates, negatively impacting your rankings.
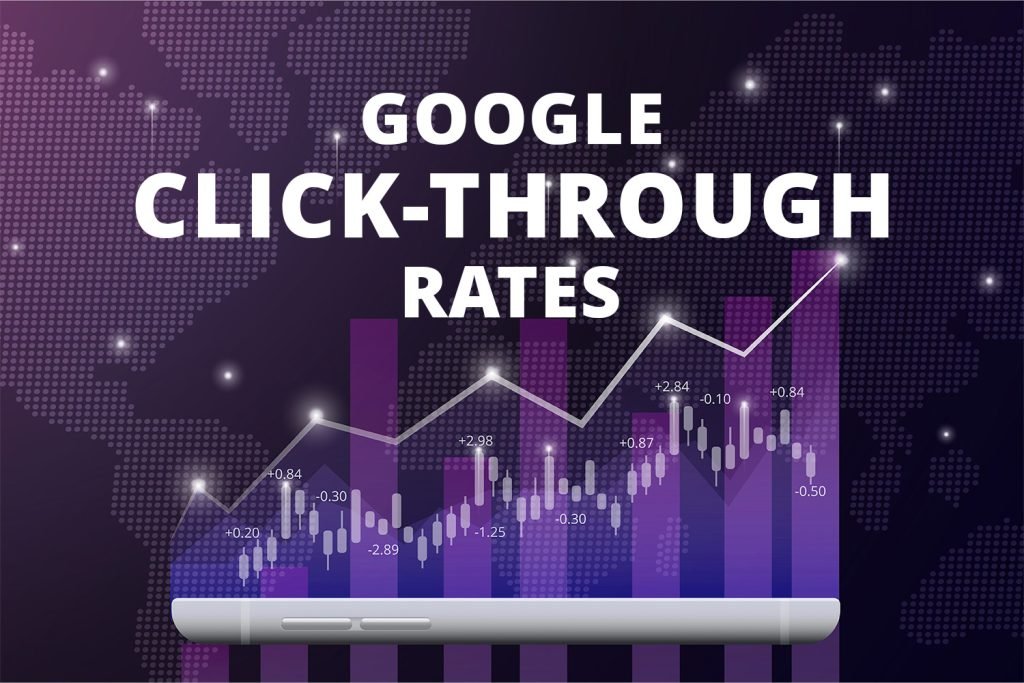
Click-Through Rates and Their Impact on Visibility
One of the most critical metrics in SEO is the click-through rate (CTR) for organic search results. Data indicates that the top-ranking position enjoys an average CTR of about 22.4 percent, dropping to 13 percent for the second spot and 10 percent for the third. These rates tend to decrease further down the page, making the first few positions highly coveted.
It’s worth noting that modern search results pages include various features like featured snippets, ads, and AI-generated summaries, which can influence these CTRs. For example, if a query triggers an AI overview, it might satisfy the user’s need without requiring a click, potentially reducing organic traffic. Marketers should monitor their own CTR data through analytics tools to understand how these elements affect performance.
To boost CTR, craft compelling title tags and meta descriptions that include targeted keywords and address user pain points. A/B testing different variations can reveal what resonates best. Additionally, structured data markup can help your pages appear in rich snippets, which often see higher engagement. Remember, higher CTR not only drives more traffic but also signals to Google that your content is relevant, potentially improving rankings over time.
The Vast Size of Google’s Index
Google’s search index is a colossal database exceeding 100 million gigabytes, containing records of hundreds of billions of webpages. This index is maintained by web crawlers that continuously scan the internet, following links to discover and update content.
For website owners, this means ensuring your site is crawlable and indexable. Use robots.txt files wisely to guide crawlers and submit sitemaps via Google Search Console to facilitate discovery. Regular content updates keep your pages fresh, encouraging more frequent crawls. If your site has issues like duplicate content or broken links, they can hinder indexing and reduce visibility.
In practical terms, a large index benefits users by providing comprehensive results, but it challenges marketers to produce unique, authoritative content. Aim for in-depth articles that cover topics thoroughly, as Google favors pages that demonstrate expertise, authoritativeness, and trustworthiness (E-A-T). This approach not only helps with indexing but also positions your site as a go-to resource.
Mobile Dominance in Searches
A significant portion of searches over 60 percent in certain regions occurs on mobile devices. This shift has prompted Google to adopt mobile-first indexing, where the mobile version of a site is prioritized for crawling and ranking.
For SEO experts, this statistic demands responsive design that ensures seamless experiences across devices. Test your site’s mobile-friendliness using Google’s tools, and optimize for touch interactions, fast loading times, and readable fonts. Mobile users often search on the go, so local SEO elements like location-based keywords become crucial.
Moreover, mobile searches tend to have different intents, such as quick answers or nearby services. Tailor content accordingly, perhaps with shorter paragraphs and clear calls to action. Ignoring mobile optimization can lead to poor rankings, as Google penalizes sites that don’t perform well on smartphones.
Geographic Distribution of Traffic
Traffic to Google varies by country, with some nations contributing more to desktop visits than others. For example, one major market accounts for nearly 27 percent of desktop traffic, followed by others at lower percentages.
This geographic insight is vital for international SEO. If your audience spans multiple countries, use hreflang tags to serve the right language and regional versions of your content. Analyze traffic sources to prioritize markets with high potential. For global brands, understanding these patterns can inform content localization strategies, ensuring cultural relevance and better engagement.
Popular Search Terms
Certain terms dominate global searches, with video platforms, AI chat tools, and social networks leading the pack. One such term garners billions of monthly searches, while others follow closely with hundreds of millions.
Marketers can leverage this by optimizing for related queries. For instance, if your content ties into popular platforms, include guides or integrations that attract this traffic. Keyword tools reveal search volumes, helping you identify opportunities to rank for high-traffic terms without excessive competition.
Query Length Trends
Most search queries consist of three to four words, showing a preference for concise yet specific phrasing. This average has remained relatively stable, varying slightly by region.
For content creators, this means focusing on mid-length keywords that match natural language. Voice search, which often uses longer phrases, is an exception, but the majority still favors brevity. Use tools to find question-based queries, as they align with user intent and can trigger featured snippets.
To expand on this, consider how query length affects competition. Shorter queries are broader and harder to rank for, while longer ones offer niche opportunities. A balanced keyword strategy incorporates both, building topical authority over time.
AI Integration in Search Results

AI-generated overviews now appear in a notable percentage of searches, around 13 percent, and this figure continues to grow. These summaries pull from multiple sources to provide quick answers at the top of results pages.
For SEO, this presents both challenges and opportunities. If your content is cited in an overview, it can drive traffic even if not in the top organic spots. To increase chances of inclusion, produce factual, well-structured content with clear headings and lists. Monitor how AI features impact your traffic and adjust by aiming for positions that still receive clicks.
Studies show these overviews reference an average of five sources, with over half overlapping top organic results. This suggests that strong SEO fundamentals remain key, but emerging signals like user interaction could boost visibility for lower-ranked pages.
Device Availability for Advanced Features
Features like visual search tools are accessible on hundreds of millions of devices, enabling users to initiate queries by interacting with on-screen elements. Adoption rates show that once tried, these tools account for a portion of ongoing searches.
This blurs traditional search boundaries, making multimodal experiences more common. Marketers should optimize images and videos with descriptive alt text and metadata to appear in these results. As adoption grows, incorporating visual elements into content strategies becomes essential.
Traffic Shifts Post-AI Launches
Following the introduction of advanced AI chat models, overall search traffic to traditional engines saw declines, with Google experiencing around an 8 percent drop in global visits. Meanwhile, specialized engines focused on privacy or AI saw gains.
This indicates a fragmenting market, where users seek alternatives for certain queries. To adapt, diversify traffic sources beyond Google, such as social media or direct newsletters. Enhance content with interactive elements to retain users longer, countering the pull of AI tools.
Market Share Dominance
Google commands a vast majority of the global search market, over 89 percent, dwarfing competitors like Bing and others.
This dominance means most optimization efforts should center on Google’s algorithms. However, exploring secondary engines can provide additional traffic. For advertisers, Google’s ecosystem offers unparalleled reach, but competition drives up costs in certain niches.
Revenue from Advertising
Ad revenues from Google’s properties have reached record highs, growing substantially over time. This financial strength funds innovations, keeping the platform ahead.
For businesses, this underscores the value of paid search alongside organic efforts. A blended strategy maximizes visibility, as ads can influence organic performance through increased brand awareness.
Decision-Making on Different Devices
Users on mobile devices take longer to decide on next actions after searching, with fewer quick decisions compared to desktop.
This may stem from smaller screens requiring more scrolling. Optimize mobile pages for scannability with bullet points, images, and intuitive navigation. Understanding this behavior helps in designing user journeys that guide decisions effectively.
Query Refinements by Device
Mobile users refine searches more often, nearly 30 percent of the time, versus under 20 percent on desktop.
This suggests initial results may not meet expectations on mobile. Improve relevance by anticipating follow-up queries and providing comprehensive answers. FAQ sections or related content links can reduce the need for refinements, improving user satisfaction.
Starting Points for Product Research
Over half of consumers begin product searches on Google, making it a top choice alongside retail giants.
Position your e-commerce site with product schema markup to appear in rich results. Content like buying guides or comparisons can capture this traffic, funneling users toward purchases.
Influence of Search Ads
Search ads are deemed the most influential by consumers across generations, outperforming other ad types.
Allocate budgets accordingly, testing ad copy for maximum impact. Combine with retargeting to nurture leads, leveraging Google’s data for precise targeting.
Engagement with Interactive Images

Shoppers engage 50 percent more with 3D images than static ones, enhancing product exploration.
Implement 3D views where possible, especially for categories like apparel or home goods. This boosts dwell time and conversions, signaling quality to search engines.
Product Listings in Shopping Data
Google’s shopping dataset includes billions of listings, with frequent updates for accuracy.
Merchants should submit feeds to this graph for visibility in shopping results. Accurate, detailed listings improve match rates, driving qualified traffic.
Reliance on Google for Local Info
Around 75 percent of consumers turn to Google for local business details.
Optimize Google Business Profiles with complete information, photos, and reviews. Local keywords in content and backlinks from regional sites strengthen presence.
Daily Use for Local Discoveries
Over 20 percent of people use the internet daily to find local businesses, with many researching multiple times weekly.
Consistent NAP (name, address, phone) citations across directories ensure discoverability. Encourage reviews to build trust and improve local rankings.
Growth in Location-Based Queries
Searches for nearby shopping have doubled globally, highlighting Maps’ role in discovery.
Claim and optimize Maps listings with hours, services, and posts. Geo-targeted ads can complement organic efforts for immediate visibility.
Calls from Business Profiles
Verified profiles generate dozens of calls monthly, facilitating customer contact.
Include multiple communication options like chat or email to capture more leads. Track these interactions to refine marketing.
Preference for Mapping Services
Nearly 90 percent of consumers favor Google’s mapping tool over alternatives.
Businesses should prioritize Google listings, though claiming others provides broader coverage. Surveys show many neglect secondary platforms, missing opportunities.
Return on Investment from Ads
Google’s ad platform offers substantial returns, with estimates of eightfold profits per dollar spent.
This ROI stems from targeted reach and measurable results. Start with small campaigns, scaling based on performance data.
Conversion Rates Across Sectors
Average conversion rates hover around 7 percent, varying by industry with automotive and pet categories leading.
Benchmark against these to set goals. Optimize landing pages for conversions with clear CTAs and trust signals.
Costly Keywords in Advertising
Certain legal keywords command high costs per click, exceeding $200 in some cases.
Budget accordingly for competitive niches, focusing on long-tail variants for cost efficiency. Quality Score improvements lower CPCs over time.
Common Voice Query Topics
Voice searches often cover weather, music, and news, with regional variations in usage.
Optimize for conversational language, as voice queries are longer. Structured data for FAQs can secure voice result positions.
Visual Search Volumes
Google’s image recognition tool processes billions of searches monthly, growing rapidly.
Alt text, image optimization, and visual sitemaps ensure inclusion. This tool aids in identifying objects, so descriptive filenames help.
To summarize key general statistics in a structured format, here’s a table highlighting core metrics:
| Statistic Category | Key Data Point | Implications for SEO |
|---|---|---|
| Searches per Minute | 9.5 million | High volume demands competitive optimization for visibility. |
| Top CTR | 22.4% for position 1 | Prioritize ranking improvements through quality content and meta tags. |
| Index Size | Over 100 million GB | Ensure crawlability with sitemaps and fresh updates. |
| Mobile Searches | Over 60% | Adopt mobile-first design and speed optimizations. |
| Popular Terms | Billions for top platforms | Target related keywords for traffic spillover. |
| Query Length | 3-4 words | Focus on mid-tail keywords matching user intent. |
Expanding on AI’s Role in Search Evolution
Diving deeper into AI-focused statistics, the integration of artificial intelligence is reshaping how results are delivered. AI overviews, which synthesize information from various sources, are becoming more prevalent. Initially appearing for a smaller fraction of queries, their frequency has increased, now covering about 13 percent of all searches. This growth reflects Google’s commitment to providing instant, comprehensive answers.
For content creators, this means adapting to a landscape where traditional clicks might decrease if users find what they need in the overview. However, being cited as a source can still drive traffic, especially if the summary piques interest for more details. To position your content for inclusion, emphasize factual accuracy, use schema markup for entities, and structure articles with subheadings that directly answer common questions. Research shows that sources in these overviews often align with top organic results, but there’s room for others to break through via superior user engagement.
Consider the mechanics: AI models like those powering overviews rely on natural language processing to extract and summarize. This favors content that’s clear, concise, and authoritative. Avoid keyword stuffing; instead, build topical clusters around core themes. For example, if your niche is digital marketing, create a hub page on search trends with spokes linking to detailed stats analyses. This not only aids AI extraction but also improves overall site architecture for better crawling.
Moreover, the average number of sources per overview around five suggests diversity in referencing. Aim to be one of them by earning backlinks from reputable sites and demonstrating E-E-A-T (experience, expertise, authoritativeness, trustworthiness). User signals, such as low bounce rates and high time on page, can elevate your content in algorithmic considerations. Tools for monitoring AI feature appearances can help track progress and refine strategies.
Another facet is the device ecosystem supporting AI features. Visual search capabilities, available on millions of Android devices, allow users to query by circling elements on their screens. This has led to a notable adoption, where it constitutes a percentage of total searches for users who engage with it. The seamless integration points to a future where search is contextual and multimodal.
Implications here are exciting for e-commerce and visual content. Optimize images with detailed captions and ensure they’re high-resolution for better recognition. If your site features products, tutorials, or infographics, this can directly boost discoverability. Think about user journeys: a circled item might lead to your page if it’s the most relevant match. Test by searching your own visuals to see how they perform.
Traffic dynamics post major AI releases also merit attention. Traditional search engines, including Google, saw traffic dips as users experimented with chat-based alternatives. Google’s global decline was around 8 percent, while niche engines gained. This fragmentation urges diversification: build email lists, engage on social platforms, and create content that AI tools might reference.
To counter this, enhance interactivity on your site quizzes, calculators, or personalized recommendations keep users engaged longer than static AI responses. SEO isn’t just about rankings anymore; it’s about creating experiences that AI can’t fully replicate.
Dominance and Economic Insights
Google’s market share, exceeding 89 percent globally, solidifies its position as the de facto search leader. Competitors hold single-digit shares, making Google the primary focus for most campaigns. Yet, this doesn’t mean ignoring others; Bing, for instance, powers certain enterprise searches and can provide untapped audiences.
Economically, ad revenues in the hundreds of billions fuel ongoing innovations. This growth trajectory shows no signs of slowing, with annual increases reflecting advertiser confidence. For businesses, this means paid search remains a viable channel, often complementing organic efforts.
Consider ROI: data suggests substantial returns from ads, amplifying organic visibility through brand searches. A holistic approach integrates both, using ads to test keywords before full organic investment.
Device-Specific Behaviors
Desktop and mobile differences extend beyond hardware. Mobile users deliberate longer, perhaps due to interface constraints. This extra time is an opportunity: provide comprehensive overviews early to aid decisions.
Refinements are more common on mobile, indicating potential mismatches. Anticipate this with predictive content, like “related searches” sections. Analytics can reveal patterns, guiding optimizations.
Consumer Patterns in Shopping

Google’s role in product discovery is pivotal, second only to major retailers. Consumers influenced by search ads highlight their potency. Interactive features like 3D views boost engagement, while vast product datasets ensure fresh results.
For local searches, Google’s ubiquity drives traffic. Profiles generating calls underscore direct impact. Mapping preferences favor Google, so prioritize there.
Paid and Visual Search Deep Dive
Ad conversion rates vary, with top industries exceeding 12 percent. Costly keywords demand strategic bidding. Voice queries focus on everyday topics, requiring natural optimization.
Visual tools process billions monthly, quadrupling in usage. This growth demands image-centric SEO.
In conclusion, these Google search statistics illuminate paths for effective marketing. By leveraging them, from optimizing for AI to enhancing local presence, you can elevate your strategy. For tailored SEO assistance, explore resources on helpmeinseo.com to implement these insights effectively.
Frequently Asked Questions About Google Search Statistics
How many searches does Google process per day?
Google handles approximately 16.4 billion searches per day.
What is Google’s global search engine market share?
Google holds around 85-90% of the global search engine market, with slight variations by device and region.
How many searches occur on mobile devices?
About 60-65% of Google searches are conducted on mobile devices.
How often do AI Overviews appear in search results? AI Overviews trigger for roughly 21% of Google searches.


Leave a Comment